Hot Topics in Preclinical Models of CNS Disease
Neuro Tuesday, 18 May 2021

Oral Session - Hot Topics in Preclinical Models of CNS Disease
Neuro
Tuesday, 18 May 2021 18:00 - 20:00
  • Viral-CEST: Exploiting AAV capsids as endogenous CEST agents for tracking of viral cell transduction
    Mark Velasquez1, Laurel Nelson1, Bonnie Lam1, Kevin Godines1, Soo Hyun Shin1, and Moriel Vandsburger1
    1Department of Bioengineering, University of California, Berkeley, Berkeley, CA, United States
    Adeno-associated virus generates endogenous CEST contrast that can be quantified.
    Figure 1. (Left) Representative Z-spectrum from AAV2 (5.25 x 10⁸ viral genomes/μL) acquired at 800MHz using 5s continuous wave saturation at saturation power of 5.7μT demonstrates significant variation between 0 – 2ppm compared to background poly-L-Lysine (PLL) CEST contrast. (Right) CEST contrast derived from Z-spectra was quantified via MTRasym and showed substantial contrast between 0.6-0.8ppm in AAV2. The source is exchangeable hydroxyl protons on the capsid surface.
    Figure 4. (Left) MTRasym spectra generated from Z-spectra acquired in phantoms containing varying capsid densities of AAV2, expressed as viral genomes per microliter, at pH 6.0 using saturation power of 6.3μT. (Right) CEST contrast demonstrated a correlation (contrast = 7*10-8* viral concentration + 1.9%) with capsid density.
  • Grey matter atrophy measured in-vivo with 9.4T MRI in the cuprizone mouse model of demyelination
    A. Max Hamilton1,2,3,4, Qandeel Shafqat1,2,3,4, Nils D. Forkert1,2,3, Ying Wu1,2,3,4, and Jeff F. Dunn1,2,3,4
    1Department of Radiology, University of Calgary, Calgary, AB, Canada, 2Hotchkiss Brain Institute, University of Calgary, Calgary, AB, Canada, 3Department of Clinical Neurosciences, University of Calgary, Calgary, AB, Canada, 4Experimental Imaging Center Cumming School of Medicine, University of Calgary, Calgary, AB, Canada
    Using 9.4T MRI, a cryoprobe, and atlas-based volumetric analysis, we identified subcortical and corpus callosum atrophy in the cuprizone mouse model of MS, following chronic demyelination at 12 weeks.
    Figure 1. Corpus callosum demyelination in cuprizone mice. Demyelination follows a rostro-caudal pattern. A) Lateral callosal demyelination rostrally. B) Medial callosal demyelination caudally.
    Figure 4. Cuprizone mice experience severe demyelination after 12 weeks on cuprizone diet compared to controls (reduced green fluorescence). Near complete demyelination seen in medial corpus callosum (A, E) and cortex (B, F). Partial demyelination was seen in the striatum (C, G) and the thalamus (D, H). Statistics were performed using Student's t-test (I). p < 0.05*; <0.01**, <0.001***.
  • Optogenetic fMRI Reveals Distinct Response Characteristics of Sensory and Limbic Thalamic Spindle-like Activities
    Xunda Wang1,2, Alex T. L. Leong1,2, and Ed X. Wu1,2
    1Laboratory of Biomedical Imaging and Signal Processing, The University of Hong Kong, Hong Kong SAR, China, 2Department of Electrical and Electronic Engineering, The University of Hong Kong, Hong Kong SAR, China
    Our optogenetic fMRI work provides direct evidence for the first time demonstrating that limbic and sensory thalamically-evoked spindle-like activities exhibit distinct brain-wide targets but similar temporal-characteristics dependent cross-modal recruitment properties.
    Brain-wide BOLD activations upon optogenetic stimulation of MD versus VPM at different frequencies. (A) Illustration of atlas-based ROI definitions in the sensorimotor cortices, higher-order cortical and limbic regions, thalamus and brainstem, and basal ganglia. (B) BOLD activation maps upon optogenetic stimulation of MD and VPM at different frequencies (Bonferroni-corrected p<0.001). MD and VPM stimulation recruited distinct brain-wide targets, but both evoked brain-wide cross-modal BOLD activations at 8Hz. (C) BOLD profiles extracted from atlas-based ROIs.
    Brain-wide BOLD activations upon 8Hz optogenetic stimulation of MD versus VPM at different number of pulses. (A) Atlas-based ROI definitions in the sensorimotor cortices, higher-order cortical and limbic regions, thalamus and brainstem, and basal ganglia. (B) BOLD activation maps upon 8Hz stimulation of MD and VPM at different number of pulses (Bonferroni-corrected p<0.001). MD and VPM stimulations showed similar decreases of brain-wide cross-modal BOLD activations when varying the number of pulses from 24 to 16/8/96. (C) BOLD profiles extracted from atlas-based ROIs.
  • Polarity of BOLD fMRI as a function of balance between excitation and inhibition
    Kostiantyn Cherkas1, G. H. Im1, and S.G. Kim2
    1Cener for Neuroscience Imaging Research (CNIR), Institute for Basic Science (IBS), Suwon 16419, Republic of Korea, Suwon, Korea, Republic of, 2Cener for Neuroscience Imaging Research (CNIR), Institute for Basic Science (IBS), Suwon 16419, Republic of Korea, Department of Biomedical Engineering, Sungkyunkwan University, Suwon, Korea, Suwon, Korea, Republic of
    To investigate neural source of positive and negative BOLD signals, we modulated a balance of excitatory and inhibitory activity (EI) within the same somatosensory area to determine whether the polarity of evoked BOLD response is reversed. 

    Figure 1. Evoked functional changes to a set of 2 different stimulation frequencies. Main response area is marked with red circle and located in primary somatosensory area, barrel field (SSp-bfd).

    A) Areas in the mice brain show positive functional changes to 4 Hz stimulation frequency.

    B) Areas in the mice brain show negative functional changes to 20 Hz stimulation frequency.

    Figure 3. Measured local calcium response. Trace displayed is the signal average within 6 mice. Subfigures A), B), C), D), refer to measured calcium signal response at respectively 2, 4, 8 and 20 Hz of stimulation frequency. Inset figure represents continuous calcium trace of all 7 different stimulation frequencies, blue solid shadowed area captures relative position of the main figure signal within stimulation trial. Units of axis on inset and main figures are same. Yellow line on the main figure denotes signal from same experimental condition but opposite whisker pad stimulation.
  • Validation of MRI Measurements of Myelination Changes in an Absence Epilepsy Mouse Model
    Gustavo Chau Loo Kung1, Juliet Knowles2, Lijun Ni2, John Huguenard2, Michelle Monje2, and Jennifer McNab3
    1Bioengineering Department, Stanford University, Stanford, CA, United States, 2Neurology Department, Stanford University, Stanford, CA, United States, 3Radiology Department, Stanford University, Stanford, CA, United States
    Our results on ex vivo mouse brains suggest a decrease in MRI derived g-ratios in the genu of the corpus callosum of a mouse model of absence epilepsy, in accordance with a similar decrease on ground truth EM measurements.
    Figure 1. Sample images showing the MRI-derived g-ratio maps for a WT mouse (a) and a HET mouse (c). The genu region is indicated in (a). EM images with 1000x zoom and segmentation of myelin (red) and axons (green) for the same two mice are shown in (b) and (d) for the WT and HET mice respectively.
    Figure 3. Error and scatter plot showing the MRI measurements of AVF, MVF and g-ratio of the WT mice (blue) and HET mice (red).
  • fMRI connectivity mapping in the awake mouse brain reveals state-dependent network reconfiguration
    Neha Atulkumar Singh1, Daniel Gutierrez-Barragan1, Elizabeth de Guzman1, Mauro Uboldi2, Ludovico Coletta1, and Alessandro Gozzi1
    1Functional Neuroimaging Laboratory, Istituto Italiano di Tecnologia, Rovereto, Italy, 2Ugo Basile S.r.L., Gemonio, Italy
    By developing a novel strategy for fMRI connectivity mapping in awake mice, we identified a possible dynamic signature of consciousness in this species.
    Figure 1. Experimental design for awake rsfMRI acquisitions. A) Mouse cradle for rsfMRI acquisitions. B) Body weight measurements in 5 representative mice across different sessions. C) Experimental timeline for habituation protocols [Abv; PS1: post-surgery day-1, PS10: post-surgery day-10, Hab: Start of habituation, HS1: habituation session-1, HS2: habituation session-2, HS3: habituation session-3, Scan: rsfMRI acquisitions]
    Figure 3. rsfMRI connectivity networks differ between awake and anesthesia. A) Seed-location for whole-brain connectivity quantifications in (B). B) Whole-brain group-averaged connectivity matrices for awake, anaesthesia and mean correlation differences across states. c) rsfMRI connectivity maps across states, and corresponding difference maps for six representative networks.
  • Sensitive imaging schemes for dynamic glucose enhanced (DGE) MRI to detect glucose uptake and clearance in mouse brain at 3T
    Jianpan Huang1, Joseph H. C. Lai1, Xiongqi Han1, Zilin Chen1, Yang Liu1, Peng Xiao1, Lin Chen2,3, Jiadi Xu2,3, and Kannie W. Y. Chan1,3,4
    1Department of Biomedical Engineering, City University of Hong Kong, Hong Kong, China, 2F.M. Kirby Research Center for Functional Brain Imaging, Kennedy Krieger Research Institute, Baltimore, MD, United States, 3Russell H. Morgan Department of Radiology and Radiological Science, The Johns Hopkins University School of Medicine, Baltimore, MD, United States, 4City University of Hong Kong Shenzhen Research Institute, Shenzhen, China
    A sensitive dynamic glucose enhanced (DGE) MRI acquisition and post-processing scheme was proposed to detect glucose signals from the brain parenchyma and cerebrospinal fluid at a low concentration of D-glucose (12.5% w/w) injection.
    FIGURE 1. MRI sequences and protocols. (A) Three different saturation modules (CPMG, onVDMP, and onSL) followed by the same readout module (RARE). DGE MRI protocol that used in DGE experiments with 50% w/w (B) and 25%/12.5% w/w (C) D-glucose injection.
    FIGURE 2. Comparison results of three DGE MRI methods with 50% D-glucose injection. Parenchyma (A) and CSF (B) DGE images acquired by CPMG, onVDMP and onSL. Parenchyma (C) and CSF (D) DGE curves acquired by CPMG, onVDMP and onSL. DGE images were averaged over sets of 4 for display (7 out of 28). Fitted ΔSmax of parenchyma (E) and CSF (F). SNR of parenchyma (G) and CSF (H).
  • Quantitative neuroimaging biomarkers using 3D UTE MRI and ferumoxytol
    Codi Gharagouzloo1, Praveen Kulkarni2, Joshua Leaston1, Kevin Johnson3, Jonathan Polimeni4, Ju Qiao5, Misung Han6, Peder Larson6, and Craig Ferris2
    1Imaginostics, Inc., Cambridge, MA, United States, 2Center for Translational Neuroimaging, Northeastern University, Boston, MA, United States, 3Medical Physics, University of Wisconsin–School of Medicine and Public Health, Madison, WI, United States, 4Martinos Center, Massachusetts General Hospital and Athinoula A. Martinos Center for Biomedical Imaging, Boston, MA, United States, 5Massachusetts General Hospital, Boston, MA, United States, 6University of California, San Francisco, San Francisco, CA, United States
    QUTE-CE MRI biomarkers detect early preclinical small vessel disease in ApoE4 rats, BBB leakage in rmTBI with sensitivity to single animals and hits, and is feasible in human neuroimaging.
    (a) QUTE-CE MRI Angiographic Quality at 3T. Imaging parameters were: TR=4ms, TE=0.1, Flip=20°, 0.4mm isotropic, 6:40 scan time, (b) Images from Cones-AFI and Resultant B1+ maps. The top two rows are from sequential ordering, with higher spoiler gradient areas for the second row. Some residual transverse magnetization affects a signal level in the center of FoV, resulting high B1+ values. The bottom row images are from golden-angle ordering, and the resultant B1+ map is really similar to Bloch-Siegert B1+ map.
    Maximum intensity projection images (MIPs) of the whole rat head at 8 months are displayed (a) pre-contrast and (b) post-contrast 14mg/kg ferumoxytol. Unique contrast-enhanced vascular MIPs are obtained and (c,d) the brain is segmented . (c) pre- and (d) post-contrast images demonstrates that the time-of-flight signal enhancement is limited to the arteries at the periphery of the FoV. (e-g) MIPs of a rat head after intrathecal injection demonstrate glymphatic (e) pre-contrast (f) after 56 minutes. (g) The dynamic mixing is visualized from 7-56min in subtraction images.
  • CEST MRI of temporal changes of hematoma in Intracerebral Hemorrhage (ICH) mouse at 3T
    Joseph H. C. Lai1, Jiaxin Liu2, Jianpan Huang1, Yang Liu1, Zilin Chen1, Peng Xiao1, Gilberto K. K. Leung2, and Kannie W. Y. Chan1,3,4
    1Department of Biomedical Engineering, City University of Hong Kong, Hong Kong, Hong Kong, 2Division of Neurosurgery, Department of Surgery, Li Ka Shing Faculty of Medicine, The University of Hong Kong, Hong Kong, Hong Kong, 3Russell H. Morgan Department of Radiology and Radiological Science, Johns Hopkins University School of Medicine, Baltimore, MD, United States, 4City University of Hong Kong Shenzhen Research Institute, Shenzhen, China
    This study examined the feasibility of CEST in monitoring ICH and its progression over two weeks. Decrease in rNOE and APT signals in lesion were observed on day7 and day3, respectively, when compared to contralateral side under insignificant iron suppression effect. 
    MR images of an ICH mouse at different time points (From left to right: before, day 1, day 3, day 7, day 14) Pixels values of the ipsilateral and the contralateral brain were extracted from the regions within the red and blue circles respectively. (A) T2-weighted reference image, (B) AREX(rNOE), (C) AREX(APT), (D) T1 map, (E) T2 map.
    (A) T1 and T2 fitting with iron content (R2 for T1 = 0.9316, Y = -734.4*log X + 1769; R2 for T2 = 0.9792, Y = -96.96*log X + 153.6). (B) AREX value with iron content. Two-way ANOVA was performed for statistical analysis as compare with the value of 0.15625mM. *P<0.05, **P<0.01, ***P<0.001. (C) A reference T2-weighted image of the phantom. Values were taken by averaging the pixels values of each tube.
  • Abnormal Oxidative Metabolism in the Gray Matter of Cuprizone Mouse Model: An in-vivo NIRS-MRI Study
    Mada Hashem1,2,3,4,5, Ying Wu1,3,4,5, and Jeff F. Dunn1,2,3,4,5
    1Department of Radiology, University of Calgary, Calgary, AB, Canada, 2Biomedical Engineering Graduate Program, University of Calgary, Calgary, AB, Canada, 3Hotchkiss Brain Institute, University of Calgary, Calgary, AB, Canada, 4Experimental Imaging Centre, University of Calgary, Calgary, AB, Canada, 5Cumming School of Medicine, University of Calgary, Calgary, AB, Canada
    Cuprizone mice have a loss of white matter and may have mitochondrial impairment. Multimodality NIRS-MRI revealed an abnormality in mitochondrial energy production and a reduction in the consumption rate of oxygen in the cortex.
    Figure 5: Representative T2-weighted images of a CPZ mouse pre- (W0), 5 weeks (W5) post- cuprizone exposure, and 4 additional weeks (W9) post cuprizone exposure termination. A strong gray-white matter contrast which was observed at baseline decreased at week 5 (red arrows) and increased back (blue arrows) after recovery (W9). Unlike in the corpus callosum, this change was not visually obvious in the cerebral cortex.
    Figure 1: A reduction in OEF, and CMRO2 in the cortex of Cuprizone (CPZ) mice but no change in CBF during demyelination. CTRL (black, n=9) and CPZ (blue, n=11) mice were imaged pre- (W0), 5 weeks (W5) post- cuprizone exposure, and 4 additional weeks (W9) post cuprizone challenge termination. Each symbol represents a different mouse (* - p ≤ 0.05, ** - p ≤ 0.01, *** - p ≤ 0.001).
Back to Top
Digital Poster Session - Preclinical Models of CNS Disease
Neuro
Tuesday, 18 May 2021 19:00 - 20:00
  • Longitudinal brain network changes in the GAERS rat model of absence epilepsy
    Leo Hebbelmann1, Lydia Wachsmuth1, Henriette Lambers1, Cornelius Faber1, Annika Lüttjohann2, and Thomas Budde2
    1Translational Research Imaging Center Clinic for Radiology, University of Münster, Münster, Germany, 2Physiology I, University of Münster, Münster, Germany
    Graph theoretical analysis of rs-fMRI data in the GAERS rat model of absence epilepsy under Isoflurane suggests long-term effects of seizures on brain networks in the epileptic rat compared to non-epileptic controls.
    Connectivity differences between GAERS and NEC at 4 months (3A) and 8 months (3B) mapped on the same-age community structure of GAERS. 56 statistically stronger connections (thick lines) were found in GAERS, while only 15 statistically stronger connections were found in NEC. NBS based on comparison of the 360 strongest connections at α=0.05. Only brain areas with significantly different connections are displayed in color.
    Age-dependent connectivity differences in GAERS and NEC, mapped onto respective 4 months community structure. In GAERS (4A) 97 stronger connections (thick lines) were found at 4 months and 22 stronger connections were found at 8 months. In NEC (4B) 9 stronger connections (thick lines) and 45 stronger connections were found at 8 months. NBS based on comparison of the 360 strongest connections at α=0.05. Only brain areas with significantly different connections are displayed in color.
  • Anatomical and diffusion tensor MRI reveal microstructural effects of tau pathology in the inter-cerebellar fibres of the hTau.P301S mouse model
    Ernest Eng1, Raimo Salo1, Heikki Tanila1, Mikko Kettunen1, and Olli Gröhn1
    1A.I. Virtanen Institute for Molecular Sciences, Finland, Kuopio, Finland
    Knowledge about how tau affects the microstructure is limited. Our anatomical and diffusion data suggests that tauopathy results in structural and microstructural changes in the hTau.P301S-Tg mouse model’s inter-cerebellar fibres, and possibly associates with the model’s motor declines.
    Fig 1. Group level pixel-wise analyses of differences between controls and hTau.P301S mice at 5 mths of age as exhibited by (A) Jacobian determinants showing local volumetric differences around inter-cerebellar fibres (white arrows), (B) FA maps depicting microstructural differences in inter-cerebellar fibres (yellow arrows) and brain stem (red arrow), (C) local volumetric changes as depicted by Jacobian determinants from 2.5 – 5 mths, (D) location of Region of Interest (ROI) analysed; in (A), (B) and (C) all coloured pixels statistically significant p<0.05, TFCE-corrected
    Fig 2. ROI analyses of DTI metrices in inter-cerebellar fibres in controls and hTau.P301S mice. ROI is defined in Fig 1D. (A) Fractional Anisotropy (FA) values at 2.5 mths, (B) FA values at 5 mths of age, (C) Mean Diffusivity (MD) values at 2.5 mths, (D) MD values at 5 mths of age, (E) Radial Diffusivity (RD) values at 2.5 mths, (F) RD values at 5 mths of age, (G) Average Diffusivity (AD) values at 2.5 mths, and (H) AD values at 5 mths of age, data statistically significant at p<0.05, FDR-corrected
  • Preliminary study of a Lafora Disease mouse model using glycoNOE MRI
    Chongxue Bie1,2,3, Yang Zhou4, Peter C. M. van Zijl1,2, Jiadi Xu1,2, Ramon C. Sun5, Matthew S. Gentry66, and Nirbhay N. Yadav1,2
    1The Russell H. Morgan Department of Radiology, The Johns Hopkins University School of Medicine, Baltimore, MD, United States, 2F.M. Kirby Research Center for Functional Brain Imaging, Kennedy Krieger Institute, Baltimore, MD, United States, 3Department of Information Science and Technology, Northwest University, Xi'an, China, 4Institute of Biomedical and Health Engineering, Shenzhen Institutes of Advanced Technology, Chinese Academy of Sciences, Shenzhen, China, 5Department of Neuroscience, University of Kentucky, Lexington, KY, United States, 6Department of Molecular and Cellular Biochemistry, University of Kentucky, Lexington, KY, United States
    glycoNOE MRI was applied to study brain glycogen accumulation in a mouse model of Lafora disease. In-vivo glycoNOE maps resemble histology, suggesting that this approach has potential for disease diagnosis, monitoring progression, and treatment response.
    Figure 1. glycoNOE MRI on brain of the Lafora disease mouse model. (A) Axial and (B) sagittal slices. Data were acquired with an RF saturation power of B1 =0.7 μT. ROIs are indicated in T2w images by a red line. The Z-spectrum was fitted with Lorentzian and Gaussian hybrid line-shape, by assuming multi-Lorentzian functions for background (blue mark) and Voigt function for glycoNOE (shown in the bottom row). The glycoNOE map was estimated from the amplitude of the corresponding Voigt line-shape.
    Figure 2. Histological images of brain for wild type (WT) and knock-out (KO, Epm2a-/-) mice which are stained with an antibody that detects Lafora bodies. Lafora bodies are abnormal accumulated in KO mouse rather than WT.
  • Quantitative Neuroimaging Study for a Non-human Primate Brain Infected with Intramuscular Ebola Virus
    Byeong-Yeul Lee1, Jeffrey M. Solomon2, Marcelo Castro1, Dong-Yun Kim3, Joseph Laux1, Becky Reeder1, Richard S. Bennett1, Dima Hammoud4,5, and Ji Hyun Lee1
    1Integrated Research Facility at Fort Detrick, Integrated Research Facility at Fort Detrick, National Institute of Allergy and Infectious Diseases, National Institutes of Health, Frederick, MD, United States, 2Clinical Monitoring Research Program Directorate, Frederick National Laboratory for Cancer Research sponsored by the National Cancer Institute, Frederick, MD, United States, 3Office of Biostatistics Research, National Heart, Lung and Blood Institute, Bethesda, MD, United States, 4Radiology and Imaging Sciences, Clinical Center, National Institutes of Health, Bethesda, MD, United States, 5Center for Infectious Disease Imaging, National Institutes of Health, Bethesda, MD, United States
    We performed quantitative neuroimaging of rhesus monkey brains infected with Ebola virus (EBOV) via the intramuscular route. We found observed a significant increase in T1 values in the late stage in prefrontal-basal ganglia-cerebella pathway, suggestive of brain involvement with EBOV.
    Figure 1. Averaged T1 maps of rhesus macaque brain in pre- and post-exposure days on DPE 3 (n=3) and DPE 5-7 (n=8), respectively. There were subtle T1 changes between pre-exposure (baseline, A) and early infection (DPE 3, C). The widespread significant T1 changes were observed in the late infection stage (DPE 5-7, D) compared to baseline (B) in the multiple regions, including the cerebellum, prefrontal, and orbital gyrus (white arrow and dotted circle).
    Figure 2. A voxel-based statistical comparison of T1 of rhesus monkey brains between pre- and post-EBOV exposure. A. There were no significant changes in T1 values between baseline (pre-infection) and early infection (DPE 3). B. A significant increase in T1 values was found however in the late EBOV infection stage (DPE 5-7). Statistical significance was considered at corrected p < 0.005 (one-tailed paired t-test, FDR correction). The colorbar indicates T scores.
  • Brain aging in cynomolgus macaques and common marmosets explored by mapping the magnetic susceptibility and R2*
    Rakshit Dadarwal1,2, Judith Mylius1, and Susann Boretius1,2,3
    1Functional Imaging Laboratory, German Primate Center, Göttingen, Germany, 2Georg August Universität Göttingen, Göttingen, Germany, 3Leibniz Science Campus Primate Cognition, Göttingen, Germany

    In this work we demonstrate the potential of QSM and R2* to characterize healthy brain aging in macaques and marmosets.

    Figure 1. QSM group average of young (7-8 years) and old (15-20 years) macaque brains. Arrows point out substructures of the basal ganglia such as putamen and globus pallidus. An increase in the magnetic susceptibility of deep gray matter nuclei can be observed with age.
    Figure 2. Group average of QSM and R2* map for the 4 marmoset age groups. A prominent increase in QSM and R2* contrast can be seen with increasing age particularly for deep grey matter nuclei. Arrows indicate substructures of the globus pallidus.
  • Brain connectivity impairments revealed by DTI and resting-state fMRI in a mouse model of Huntington’s disease
    Jean-Baptiste Pérot1, Marina Célestine1, Miriam Riquelme-Pérez1, Carole Escartin1, Marc Dhenain1, Emmanuel Brouillet1, and Julien Flament1
    1Université Paris-Saclay, Commissariat à l’Energie Atomique et aux Energies Alternatives (CEA), Centre National de la Recherche Scientifique (CNRS), Molecular Imaging Research Center (MIRCen), Laboratoire des Maladies Neurodégénératives, Fontenay-aux-Roses, France
    Our imaging protocol combining rs-fMRI and DTI in a mouse model of Huntington's Disease (HD) evidenced vulnerable brain networks. FC loss and RD modifications in the white matter of zQ175 point out the key role of brain connectivity in HD.
    Figure 2: Dictionary Learning analysis of rs-fMRI data. a-h) Regions extracted from 10 components DL. i) top-right: Functional connectivity of extracted regions’ difference between WT and zQ175. Bottom-left: representation of significant (red) and non-significant (blue) differences. Red and green frames highlight somato-motor and Default Mode networks respectively.
    Figure 3: Diffusion Tensor Imaging results after TBSS analysis. Green regions represent mean white matter skeleton as used in TBSS pipeline. Red-yellow zones show clusters of voxels with significant decrease of FA in zQ175 mice. Blue-light blue zones show clusters of voxels with increased RD in zQ175 mice (p<0.05).
  • High Resolution DTI Tractographic Analysis in a Mouse Model of Pruritis
    Talaignair N Venkatraman1, Ouyang Chen2, Allen W Song3, Ru-Rong Ji2, and Christopher D Lascola1
    1Radiology, Duke University Medical Center, Durham, NC, United States, 2Neurobiology, Duke University Medical Center, Durham, NC, United States, 3BIAC, Duke University Medical Center, Durham, NC, United States
    In a CTCL mouse model of chronic pruritis, we show a statistically significant increase in fiber tract number and other DTI markers of tract integrity through the thalamus and hippocampus.  
    Figure 1: The fiber Tracts pass through Thalamus (Top Row) and Hippocampus (Bottom Row) without parcellation. Fiber Tract Numbers (FTN) and corresponding Fractional Anisotropy (FA) with Control and CTCL groups are also shown. t-test * p0.05.
    Figure 2: After Parcellation, Fiber Tract Numbers (FTN) and Fractional Anisotropy (FA) for (A) Hippocampus-Caudate.Putamen, (B) Hippocampus-Thalamus and (C) Thalamus-Caudate-Putamen are shown. t-test * p 0.05 and ** p 0.01.
  • Alteration of basal ganglia thalamo-cortical loop in hemiparkinsonian mouse model
    Tomokazu Tsurugizawa1, Yuki Nakamura2,3,4, Yukari Nakamura2,3,4, Assunta Pelosi2,3,4, Boucif Djemai5, Clement Debacker6, Jean-Antoine Girault2,3,4, and Denis Herve2,4,7
    1Human Informatics and Interaction Research Institute, National Institute of Advanced Industrial Science and Technology (AIST), Tsukuba, Japan, 2Inserm UMR-S 1270, Paris, France, 3Sciences and Technology Faculty, Sorbonne Universite, Paris, France, 4Institut du Fer à Moulin, Paris, France, 5NeuroSpin/CEA-Saclay, Gif-sur-Yvette, France, 6Inserm, UMR1266, Paris, France, 7Sorbonne Universite, Paris, France
    Ipsilateral thalamic nuclei are key regions for functional and structural alterations in basal ganglia-thalamo-cortical loop in hemiparkinsonian mice.
    Figure 1 (A) 6-OHDA is microinjected into the medial forebrain bundle (MFB) to unilaterally lesion dopamine ascending pathways. SNc, substantia nigra pars compacta. (B) Schema of experimental protocol. fMRI data were acquired for 50 min. For functional connectivity analysis, BOLD images were analyzed in two time-windows of 10 min, 10 min before and 30 min after a L-DOPA injection.
    Figure 3 ROI-ROI matrices of correlation coefficients in (A) sham-operated mice and (B) 6-OHDA-lesioned mice before injection. Color bar, correlation coefficient. Thirty-six ROIs were classified in the cortex (including somatosensory cortex), subcortex (including striatum, GPi, GPe, SNR and SNC), and thalamus (including STN, MD and CM). (C) Differences between 6-OHDA-lesioned and sham mice before L-DOPA treatment. Left lower triangle panel shows t-values and right upper triangle panel shows significant difference (p < 0.05, network based statistic). Color bar, t-values.
  • In vivo Fixel-Based Analysis of diffusion MRI in manifested Huntington’s disease in the zQ175 HD model
    Nicholas Vidas-Guscic1, Johan Van Audekerke1, Ben Jeurissen2, Jasmien Orije1, Tamara Vasilkovska1, Dorian Pustina3, Haiying Tang3, Roger Cachope3, Longbin Liu3, Mette Skinbjerg3, Celia Dominguez3, Ignacio Munoz-Sanjuan3, Annemie Van der Linden1, and Marleen Verhoye1
    1Bio-Imaging Lab, university of Antwerp, Antwerp, Belgium, 2Vision Lab, university of Antwerp, Antwerp, Belgium, 3CHDI foundation, Princeton, NJ, United States
    Whole-brain and region-based diffusion tensor, diffusion kurtosis and fixel-based analysis indicate the presence of micro- and macrostructural differences in many fiber populations throughout the brain in the zQ175 mouse model of Huntington's disease.
    Figure 2: Fixel-based analysis outcome for comparison zQ175 WT>HET. The statistical maps show significant differences (wildtype > heterozygous) for fiber density (FD) (top), fiber cross-section (FC) (middle) and the (fiber density x cross-section) (FDC) combination metric (bottom). Significant fixels (PFWE<0.05) are mapped to a 200.000 streamline tractogram and coloured based on their percentage effect and superimposed on a fiber-orientation distribution (fod) template (n=9 WT, n=9 HET).
    Figure 3: Region based analysis of fixel, tensor and kurtosis metrics. A) Overview of tracts of interest, selected following FBA. B) P-values corresponding to unpaired t-tests (wildtype vs heterozygous) for each metric in each region/tract of interest are displayed in the table. Green boxes indicate the statistical tests that survive FDR correction. Blue and red characters indicate a resp. lower or higher group average in zQ175 heterozygous compared to zQ175 wildtype animals.
  • Reproducibility evaluation on resolving complex fiber orientations using diffusion spectrum imaging at 3T and 7T
    Nan-Hao Chen1,2, Kuan-Hung Cho2, Yi-Ping Chao3,4, Sheng-Min Huang2, Norihiro Sadato5, Li-Wei Kuo2,6, and Masaki Fukunaga5
    1Biomedical engineering and Environmental sciences, National Tsing Hua University, Hsinchu, Taiwan, 2Institute of Biomedical Engineering and Nanomedicine, National Health Research Institutes, Miaoli, Taiwan, 3Department of Computer Science and Information Engineering, Chang Gung University, Taoyuan, Taiwan, 4Graduate Institute of Biomedical Engineering, Chang Gung University, Taoyuan, Taiwan, 5Division of Cerebral Integration, Department of System Neuroscience, National Institute for Physiological Sciences, Okazaki, Japan, 6Institute of Medical Device and Imaging, National Taiwan University College of Medicine, Taipei, Taiwan
    This study investigated the reproducibility of diffusion spectrum imaging (DSI) at different field strengths and found that DSI at 7T could provide relatively better reproducibility than that at 3T for resolving the crossing fibers.
    (a) Orientational similarity (SIM) maps of different voxel sizes and field strengths. (b) Averaged SIM of single-fiber and crossing-fiber groups.
    (a) Deviation angle (AngleDev) maps of different voxel sizes and field strengths. (b) Averaged AngleDev of single-fiber and crossing-fiber groups.
  • High-Resolution, Whole-Brain T1 and T2 Mapping of Monkey Using 3D Magnetic Resonance Fingerprinting at 9.4 T
    Yuning Gu1, Lulu Wang2, Hongyi Yang2, Yun Wu2, Yong Chen3, Kai Zhong2, and Xin Yu1,3,4
    1Biomedical Engineering, Case Western Reserve University, Cleveland, OH, United States, 2High Magnetic Field Laboratory, Chinese Academy of Sciences, Hefei, China, 3Radiology, Case Western Reserve University, Cleveland, OH, United States, 4Physiology and Biophysics, Case Western Reserve University, Cleveland, OH, United States
    This study developed a 3D MRF method for T1 and T2 mapping of monkey brain at 9.4 T.  The high SNR provided by a conformal head coil enabled whole-brain coverage at 0.35x0.35x1 mmresolution.
    Figure 4. In vivo results. A&B. T1 (A) and T2 (B) maps of a 4- (top) and 6-year-old (bottom) monkey in the coronal, axial, and sagittal views. The red arrow indicates lower T2 value in globus pallidus in the 6-year-old monkey.
    Figure 3. Ex vivo results. A&B. T1 (A) and T2 (B) maps by IR-SE (T1) or SE (T2), MRF without B1 correction, and MRF with B1 correction. The red arrow indicates T2 overestimation. C. Maps of B1 factor of the conformal coil. D. Color-coded ROIs. E&F. Boxplots of T1 (E) and T2 (F) values in selected ROIs.
  • Early Adoptive Transfer of T Cells Decreases Brain Bleeding during Vesicular Stomatitis Virus Infection: A MRI Study
    Li Liu1, Stephen Dodd1, Ryan Hunt1, Nikorn Pothayee1, Nadia Nadia Bouraoud1, Dragan Maric1, E Ashley Moseman1, Dorian B McGavern1, and Alan P Koretsky1
    1National Institute of Neurological Disorders and Stroke, National Institute of Health, Bethesda, MD, United States
    Using microbleeds as an MRI marker of neuroinflammation the time course of Vesicular Stomatitis Virus nasal infection of the mouse brain was monitored. Adoptive transfer of virus specific CD8 T cells reduced brain bleeding. A method to track T cells by MRI was developed.
    Figure 2. Adoptive transfer of CD8 T cells decreased brain bleeding and cleared virus. MR images of the turbinates (A), OB (B), and brain (C) from non-treated and CD8 T cell treated mice on 6 (upper panel) and 11-dpi (lower panel). (D-F) Quantification of hypointensity spots revealed that CD8 T cells transfer protected brain vessel integrity. (G) CD8 T cells reduced viral titers on 6-dpi. (H-I) IHC study revealed that CD8 T cells infiltrated and proliferated in the GL (H) and core (I) of the OB.
    Figure 1. MRI detected microbleeds in turbinates, OB, and frontal brain since 4-dpi and monitored the vessel breakdown during VSV brain infection. MR images of the turbinates (A), OB (B, C), and brain (D, E) from normal mouse and VSV-infected mice on 4, 6, and 11-dpi. (D, E) The inserted figures were the enlarged views of the framed bleeding sites in the full views. Red arrow, bleeds. (F) Quantification of volume of hypointensity at the turbinates and numbers of hypointensity spots at the OB and brain. (G) Viral titers at the OB on 6 and 11-dpi. (H) IHC staining of the OB and brain.
  • Regional brain MRI features reveal the histological alterations in chronic pain: an MRI-based cell imaging study
    Lei Wei1, Ming Ding1, Xiao Xiao1, and He Wang1,2
    1Institute of Science and Technology for Brain-Inspired Intelligence, Fudan University, shanghai, China, 2Human Phenome Institute, Fudan University, Shanghai, China, Shanghai, China
    We combine the ultra-high field magnetic imaging and cell imaging technique to verify the importance of some brain region in non-human chronic pain model.
    Group comparison between CCI rat and healthy controls. The insula and nucleus accumbens showed significantly increased Alff in the CCI group (red area). The Alff was found significantly reduced in the motor cortex (blue area).
    Immunohistochemical map of CCI rat. The dotted-line box and white arrows indicate the expression level of the p-Erk increase significantly in insula, S1 and NAc.
  • A fiber clustering-based atlas of the chimpanzee deep brain structural connectivity using diffusion MRI
    Maëlig Chauvel1, Ivy Uszynski1, William Hopkins2, Jean-François Mangin1, and Cyril Poupon1
    1Université Paris-Saclay, CEA, CNRS, BAOBAB, Neurospin, Gif-sur-Yvette, France, 2Keeling Center for Comparative Medicine and Research, The University of Texas MD Anderson Cancer Center, Bastrop, TX, United States
    Thanks to the unique imaging data collection provided by the National Yerkes Primate Research Center, we propose here a novel long bundle atlas of the white matter of the chimpanzee brain using diffusion MRI-based tractography and advanced fiber clustering techniques
    Figure 2. Left hemisphere principal long fascicles atlas of the chimpanzee brain. Views : Left- coronal, middle - sagital, right - frontal. Abbreviations : Sup. : Superior, Post : Posterior, Ant : Anterior
    Figure 1. Steps allowing the obtaining of the long white matter bundles intra-subject clusters including a registration of the different anatomical and diffusion images to the template, a whole brain deterministic tractography, leading to an intra-subject fiber clustering.
  • Neurite Orientation Dispersion and Density Imaging in a Pre-clinical Model of Repetitive Mild Traumatic Brain Injury
    Patrick McCunn1, Xiaoyun Xu2, Alex Li2, Arthur Brown2, and Robert Bartha2
    1Patrick McCunn, SickKids Research Institute, Toronto, ON, Canada, 2Robarts Research Institute, London, ON, Canada
    Neurite Orientation Dispersion and Density Imaging (NODDI) was able to detect changes in the corpus callosum within the first two hours following both a primary and secondary closed skull controlled cortical impact. These results suggest an early microstructural response to repetitive mTBI.
    Figure 2 - Single-subject axial slices of A) raw diffusion data B) Neurite Density Index (NDI), C) Orientation Dispersion Index (ODI), D) Isotropic Volume Fraction (IsoVF), E) Fractional Anisotropy (FA), F) Mean Diffusivity (MD), G) Axial Diffusivity H), Radial Diffusivity.
    Figure 3 – Mean ± SEM metrics within the corpus callosum for injured and control subjects. Note, injury 1 took place at timepoint 1 and injury 2 took place at timepoint 4. For NDI and ODI, a repeated measures ANOVA was used to determine individual differences amongst the injured and control groups. Post-hoc pairwise comparisons (Bonferroni corrected) were then determined between individual timepoints within each group. Statistically significant (p < .05) pairwise differences are indicated by *.
  • Increased functional connectivity but intact memory performance in tauopathy mouse at pre-tangle stage
    Ling-Yun Fan1, Hsu-Lei Lee1, Robert Sullivan1, Elizabeth Coulson1,2, Juan Carlos Polanco1,2, and Kai-Hsiang Chuang1,3
    1Queensland Brain Institute, University of Queensland, St Lucia, Australia, 2Clem Jones Centre for Ageing Dementia Research, University of Queensland, St Lucia, Australia, 3Centre for Advanced Imaging, University of Queensland, St Lucia, Australia
    Altered functional connectivity proceeds behavioral change and overt neuropathology in young tauopathy mouse model.
    Increased functional connectivity areas (red) in rTg4510 mouse. EC: Entorhinal cortex.
    AT8 (1000x) immunohistochemical stain of 2.5 m/o rTg4510 (A: entorhinal cortex; B: frontal cortex) and littermate (C : Hippocampus; D: frontal cortex)
  • Spatio-temporal alterations in resting-state co-activation patterns in a rat model of sporadic Alzheimer’s disease
    Yujian Diao1,2,3, Rolf Gruetter3, and Ileana O. Jelescu1,2
    1CIBM Center for Biomedical Imaging, Lausanne, Switzerland, 2Animal Imaging and Technology, Ecole Polytechnique Fédérale de Lausanne, Lausanne, Switzerland, 3Laboratory of Functional and Metabolic Imaging, Ecole Polytechnique Fédérale de Lausanne, Lausanne, Switzerland
     Dynamic functional connectivity in a rat model of Alzheimer’s was marked by early hyper-connectivity vs control rats, and a decline of specific brain states over time – both consistent with static FC analysis.
    Fig. 5. Longitudinal evolution of CAPs for each group. A & B: 5 main CAPs based on the 2-week data for CTL & STZ group, respectively. C & D: longitudinal changes in 4 metrics of the 5 CAPs for CTL and STZ group, respectively. In CTL rats, no significant difference was detected with time. However, major longitudinal differences were found in the STZ group. CAP 1 & 2 occurred increasingly less and tended to become transit states with short duration, resilience and higher betweenness. Those CAPs cover mostly visual and somatosensory cortex, PPC, RSC and striatum.
    Fig. 2. Intergroup comparison of CAPs at 2 weeks. A & B: 5 main CAPs based on CTL & STZ, respectively. C & D: intergroup differences in 4 metrics for CAPs in A & B, respectively. No significant differences were found when CTL was the reference (C) while the main CAPs 2, 3 & 4 identified from the STZ group (D) had significantly more occurrences and higher resilience than their counterpart in CTL. These CAPs mainly cover RSC, PPC, ACC, visual, motor and somatosensory cortex, thalamus, hypothalamus and striatum.
  • Automatic Segmentation of Brain Lesions in the Cuprizone Mouse Model of Multiple Sclerosis
    Yuki Asada1, Luke Xie2, Skander Jemaa3, Kai H. Barck2, Tracy Yuen4, Richard A.D. Carano3, and Gregory Z. Ferl1
    1Pharmacokinetics & Pharmacodynamics, Genentech, Inc., South San Francisco, CA, United States, 2Biomedical Imaging, Genentech, Inc., South San Francisco, CA, United States, 3PHC Data Science Imaging, Genentech, Inc., South San Francisco, CA, United States, 4Neuroscience, Genentech, Inc., South San Francisco, CA, United States
    A fully convolutional U-Net neural network for 3D images is trained to automatically detect and segment brain lesions in MRI scans of the cuprizone mouse model for multiple sclerosis, where impact of image preprocessing and augmentation steps on U-Net performance is evaluated.
    Figure 1. Three representative hold-out test scans. A) The transverse slice approximately through center of the lesion is shown representative scans, along with B) Ground truth and C) CNN-predicted ROIs, using the trained model indicated in Table 1, row 8. D) An overlay of the 2 ROIs is shown, with overlapping area indicated in yellow.
    Figure 4. Per-animal predicted volumes and dice similarity coefficients. A) Distribution of DSC achieved during training (network in Figure 2, row 8) vs. volume (units are number of voxels) of ground truth ROIs. B) Predicted ROI volume vs. ground truth volume (units are number of voxels). Prediction is performed using trained network shown in Figure 2, row 8.
  • Ultrafast Skull Stripping of Mouse Brain Multi-Modality MR Images Using Deep Learning with Knowledge Transfer
    Ziqi Yu1, Yuting Zhai1, Wenjing Xu1, Xiang Chen1, and Xiao-Yong Zhang1
    1Institute of Science and Technology for Brain-Inspired Intelligence, Fudan University, Shanghai, China
    We present the U-Net with Nonlocal Position-aware (NPA) block using domain knowledge transfer. The results showd that our end-to-end method achieves high dice scores in several MR modalities with ultrafast processing speed which is two orders of magnitude faster than atlas-based methods. 
    Figure 2: Structure of the network. Nonlocal position-aware block (NPAB) is deployed in the bottleneck of U-Net. The number of channels indicates below convolution blocks. The parameters are shared and reused in two training stages.
    Figure 4: Comparison of different methods performance in same-domain(T2) and cross-domain(SWI and ASL).
  • Inhomogeneous Magnetization Transfer (ihMT) MRI and Coherent Anti-stoke Raman Scattering (CARS) microscopy applied on LPC demyelinating model
    Andreea Hertanu1,2, Cem Karakus3,4, Lucas Soustelle1,2, Victor N. D. Carvalho1,2,5, Gopal Varma6, David C. Alsop6, Bilal El Waly3,4, Olivier M. Girard1,2, Franck Debarbieux3,4, and Guillaume Duhamel1,2
    1Aix Marseille Univ, CNRS, CRMBM, Marseille, France, 2APHM, Hôpital Universitaire Timone, CEMEREM, Marseille, France, 3Aix Marseille Univ, CNRS, INT, Marseille, France, 4Aix Marseille Univ, CNRS, CERIMED, Marseille, France, 5Aix Marseille Univ, CNRS, ICR, Marseille, France, 6Division of MR Research, Radiology, Beth Israel Deaconess Medical Center, Harvard Medical School, Boston, MA, United States
    The rostro-caudal ihMTR profile in the LPC-incubated spinal cord follows the dynamics of demyelination and axonal loss measured by microscopy. T1Ds, T1 and T2  quantification in the lesion showed different values than those obtained in the ventral WM taken as reference.
    Figure 1: Schematic depiction of two CARS (magenta) and axonal (cyan) signals (a) and representative axial and coronal Maximum Intensity Projection views of the healthy (b) and demyelinated (c) spinal cords with CARS (myelin, magenta) and Thy1–CFP fluorescence (axons, cyan) contrasts.
    Figure 2: Rostro-caudal profiles of ihMTR, CARS signal and axonal density normalized to the mean of their values at +3 mm and -3 mm from the lesion, measured in (a) PBS-incubated spinal cord and (b) LPC-incubated spinal cord. (c) Dorso-ventral profile of absolute ihMTR in the triangle of WM dorsal tracts.
Back to Top
Digital Poster Session - CNS Disease Mechanisms by Quantitative MRI: Clinical
Neuro
Tuesday, 18 May 2021 19:00 - 20:00
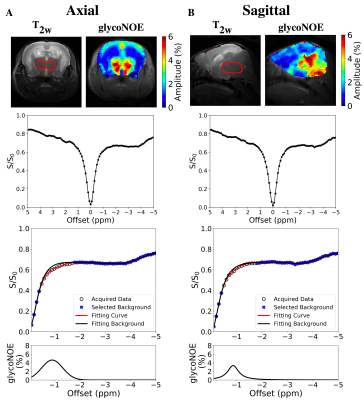
  • Determining Spinal Cord pH using Chemical Exchange Saturation Transfer (CEST) MRI
    Alicia Cronin1,2, Patrick Liebig3, Sarah Detombe4, Neil Duggal4, and Robert Bartha1,2
    1Medical Biophysics, University of Western Ontario, London, ON, Canada, 2Centre for Functional and Metabolic Mapping, Robarts Research Institute, London, ON, Canada, 3Siemens Healthineers, Erlangen, Germany, 4Clinical Neurological Sciences, University Hospital, London Health Sciences Centre, London, ON, Canada
    A prototype 2D gradient echo CEST sequence utilizing a gradient-echo readout with centric reordering on a Siemens scanner was utilized in conjunction with a respiratory correction method to improve amide proton CEST contrast at 3.0 T in the spinal cord.
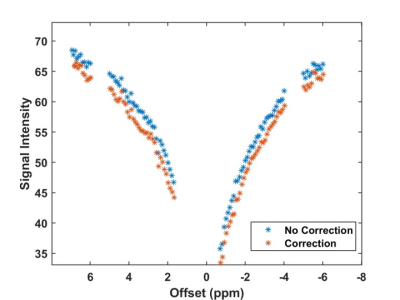
    Figure 2: Demonstration of the respiratory correction in a full CEST spectrum collected in the spinal cord with no correction (blue) and implemented correction (orange) demonstrated.
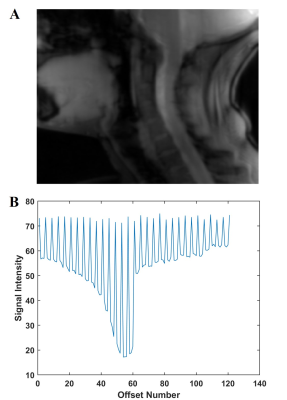
    Figure 1:

    A: Raw sagittal spinal cord CEST image.

    B: CEST spectrum of spinal cord with the interleaved non-saturated scans demonstrating the global respiratory effect.

  • The Added Value of Inflow-Based Vascular-Space-Occupancy and Diffusion-Weighted Imaging in Preoperative Grading of Gliomas
    Haimei Cao1, Xiang Xiao1, Jun Hua2,3, Guanglong Huang4, Xiaodan Li1, Wenle He1, Jie Qin1, and Yuankui Wu1
    1Department of Medical Imaging, Nanfang Hospital, Southern Medical University, Guangzhou, China, 2Neurosection, Division of MRI Research, Department of Radiology, Johns Hopkins University School of Medicine, Baltimore, MD, United States, 3F.M. Kirby Research Center for Functional Brain Imaging, Kennedy Krieger Institute, Department of Radiology, Johns Hopkins University School of Medicine, Baltimore, MD, United States, 4Department of Neurosurgery, Nanfang Hospital, Southern Medical University, Guangzhou, China
    Both iVASO-rCBVa and DWI-mADC can predict gliomas grades and combining these two parameters can further improve diagnostic performance. Also, VASO and DWI have the added value to structual MRI in preoperative prediction of tumor grading of gliomas.
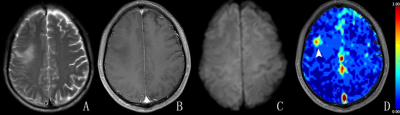
    Figure 2. Right frontal lobe anaplastic oligodendroglioma in a 51-year-old male (Grade III). The lesion in the right frontal lobe was iso-intense with perilesional edema on T2WI (A) and showed no enhancement on contrast-enhanced T1WI (B). The lesion showed an iso-intensity on diffusion-weighted image (C) and the focus of elevated arteriolar perfusion (arrowhead) on CBVa map (D). On review 1, the lesion was diagnosed as a low-grade glioma. On review 2, the lesion was diagnosed as a high-grade glioma.
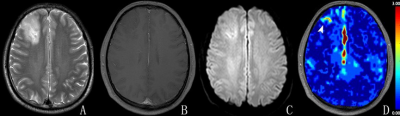
    Figure 1. Right frontal lobe anaplastic astrocytoma (Grade III) in a 39-year-old male. The lesion in the right frontal lobe was hyper-intense on T2WI (A) and showed no enhancement on contrast-enhanced T1WI (B). The lesion showed a slight hyper-intensity on diffusion-weighted image (C) and the focus of elevated arteriolar perfusion (arrowhead) on CBVa map (D). On review 1, the lesion was diagnosed as a low-grade glioma. On review 2, the lesion was diagnosed as a high-grade glioma.
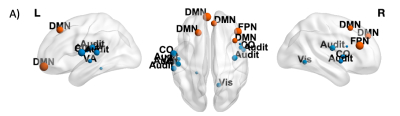
  • Alterations in brain connectivity as duration of disease increases in Parkinson's disease.
    Priyanka Bhat1, S Senthil Kumaran2, Achal K Srivastava1, and Vinay Goyal3
    1Neurology, AIIMS, Delhi, India, 2Nuclear Magnetic Resonance, AIIMS, Delhi, India, 3Neurology, Medanta, The Medicity, Gurgaon, India
     A functional connectivity study revealing altered cortico-subcortical connectivity with progressively declining motor function in Parkinson's disease as the duration of the disease increases. 
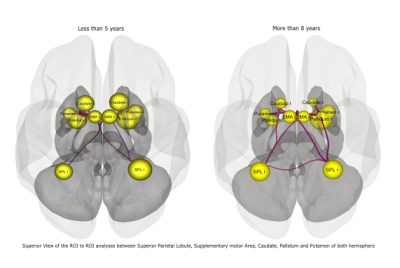
    Figure 2: ROI to ROI connectivity between the 3 groups : A- Less than 5 years B- 5 to 8 years C- More than 8 years.
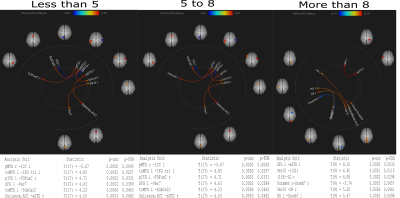
    Figure 1: Seed to seed connectivity between the 3 groups : A- Less than 5 years B- 5 to 8 years C- More than 8 years.
  • DTI and NODDI assessment of posterior optic pathway function in sellar and parasellar tumor patients
    Eun-Jung Choi1, Koung Mi Kang2, Woojin Jung1, Jongho Lee1, Seung Hong Choi2, and Yong Hwy Kim3
    1Department of Electrical and Computer Engineering, Seoul National University, Seoul, Korea, Republic of, 2Department of Radiology, Seoul National University Hospital, Seoul, Korea, Republic of, 3Department of Neurosurgery, Seoul National University Hospital, Seoul, Korea, Republic of
    DTI and NODDI parameters in the optic radiations were significantly correlated with a preoperative visual field impairment score and associated with improvement of postoperative visual field impairment in patients with the compression of optic chiasm.
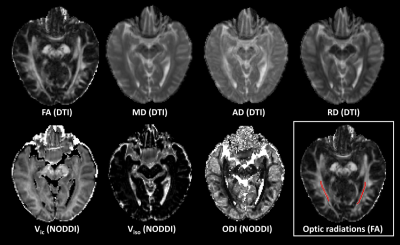
    Figure 1. Representative DTI and NODDI parameter maps. The each side optic radiation was drawn on the FA map.
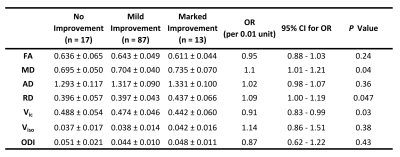
    Figure 4. DTI and NODDI Parameters and Postoperative Visual Field Improvement. Ordinal logistic regression was performed using 3 ordinal outcomes (no improvement or worse after surgery, Δ VFIS = 0 ~ 4; mild improvement after surgery, Δ VFIS = -4 ~ -1; and marked improvement after surgery, Δ VFIS = -8 ~ -5).
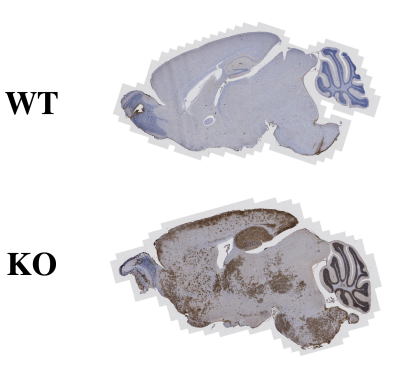
  • White Matter in Metachromatic Leukodystrophy as Assessed by Myelin Water Fraction and Diffusion Tensor Imaging
    Laleh Eskandarian1,2, Safak Parlak3, Onur Afacan4,5, Ceren Günbey6, Nesibe Gevher Ertuğrul6, Banu Anlar6, and Kader Karli Oguz2,3
    1Neuroscience Department, Bilkent University, Ankara, Turkey, 2National Magnetic Resonance Research Center (UMRAM), Bilkent University, Ankara, Turkey, 3Faculty of Medicine, Department of Radiology, Hacettepe University, Ankara, Turkey, 4Department of Radiology, Boston Children’s Hospital, Boston, MA, United States, 5Department of Radiology, Harvard Medical School, Boston, MA, United States, 6Department of Pediatrics, Hacettepe University, Ankara, Turkey
    MLD is a dysmyelinating autosomal recessive lysosomal storage disease. T2WI may not show the disease involvement accurately, especially in early phases where a bone marrow transplant can be a treatment option. We used Myelin Water Fraction and DTI to investigate WM in patients with MLD.
    Figure 1. Axial T2WI and T2 MWF maps of a 7-year old female HC (A) and two patients with MLD, 4 and 9-years old at (B, C respectively) with varying severity of leukodystrophy. Both patients have reduced MWF compared with HC in A. Although slight hyperintensity is noticed on T2WI; the patients have markedly low myelin on MWF.
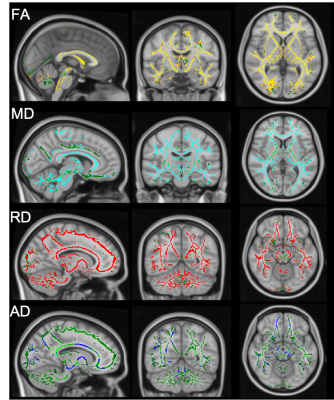
    Figure 2. Shows TBSS maps derived from DTI studies from the patients and HCs. Compared with HCs, FA map shows widespread significant reduction (A), MD and RD maps show increase (B and C ) and AD map shows a limited reduction in WM of the patients.
  • Exploring edematous nerve fibers by using Neurite Orientation Dispersion and Density Imaging
    Shin Tai Chong1, Xinrui Liu2, Hung-Wen Kao3, Chien-Yuan Eddy Lin4, Sanford PC Hsu5, and Ching-Po Lin1
    1Institute of Neuroscience, National Yang-Ming University, Taipei, Taiwan, 2Department of Neurosurgery, First Hospital of Jilin University, Jilin, China, 3Tri-Service General Hospital, National Defense Medical Center, Taipei, Taiwan, 4GE Healthcare, Taipei, Taiwan, 5Department of Neurosurgery, Neurological Institute, Taipei Veterans General Hospital, Taipei, Taiwan
    Neurite Orientation Dispersion and Density Imaging (NODDI)-based tractography could improve the reconstruction of the fiber tracts that by tracking through regions of peritumoral edema. 
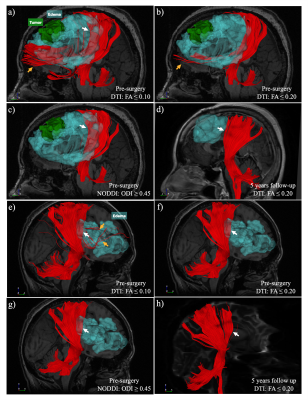
    Two examples (a-d, meningioma, WHO grade II; e-h, malignant B-cell lymphoma) of visual comparison between DTI and NODDI-based CST reconstruction. NODDI-based tractography with ODI has better performance in the region of peritumoral edema and fewer false-positive tracts (c & g, white arrow). After the vasogenic edema subsided, the DTI-based tractography with FA ≤ 0.2 shows CST similar to the pre-surgery NODDI-based CST (d & h).
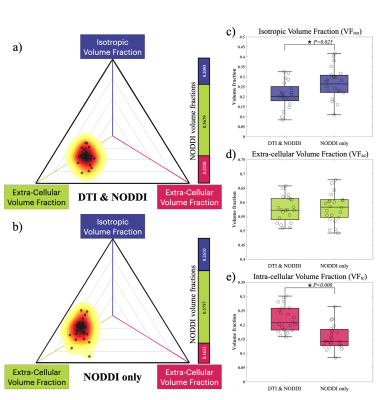
    NODDI's volume fraction distributions in the DN group and N group are plotted with a 2D barycentric coordinate system. As compared with the DN group (a), the N group (b) distribution shows a left upper shift in the coordinate system. There is no significant difference in VFec (P = 0.733, d), but significant differences in VFic (P < 0.001, e) and VFiso (P = 0.025, c).
  • Assessment of IDH1 Mutation Status and MGMT Promoter Methylation Status of Gliomas Using DWI, IVIM and DKI
    Yan Xie1, Shihui Li1, Nanxi Shen1, Weiyin Vivian Liu2, and Wenzhen Zhu1
    1Department of Radiology, Tongji Hospital, Tongji Medical College, HUST, Wuhan, China, 2MR Research, GE Healthcare, Beijing, China
    Diffusion MRI parameters were able to significantly distinguish the mutation state of IDH1 in low-grade gliomas, as well as the methylation state of the MGMT promoter, but not in glioblastomas.
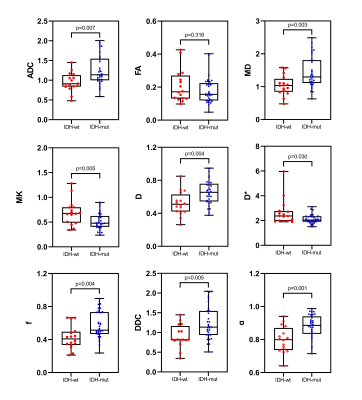
    Figure 3 Box and whisker plots of DWI, IVIM and DKI metrics in lower-grade gliomas stratified according to IDH1 genotype (IDH1 mutant and IDH1 wild type). Boxes represent the median ± quartiles, with whiskers extending to the maximum and minimum values.
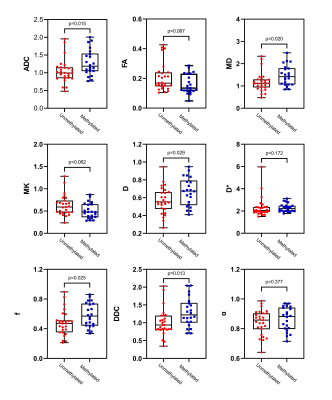
    Figure 4 Box and whisker plots of DWI, IVIM and DKI metrics in lower-grade gliomas stratified according to MGMT promoter status (methylated and unmethylated). Boxes represent the median ± quartiles, with whiskers extending to the maximum and minimum values.
  • NODDI in detecting cognitive decline in patients with radiation-induced brain injury: comparison with DTI
    Weike Zeng1 and Mengzhu Wang2
    1Sun Yat-sen Memorial Hospital, Sun Yat-sen University, Guangzhou, China, 2MR Scientific Marketing, Siemens Healthcare, Guangzhou, China
    Decreased ICVF value in brain edema lesion indicated the reduction of neurite density, and was associated with cognitive decline in RI. NODDI as a new MRI diffusion technique may contribute to better understanding of pathophysiology of cognitive decline in RI than DTI.
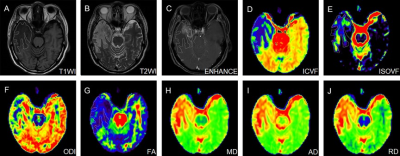
    Figure 1. NODDI maps of a patient with RI, together with DTI maps, T1WI, T2WI and enhanced images. RI, radiation-induced brain injury; T1WI, T1-weighted imaging; T2WI, T2-weighted imaging; FA, fractional anisotropy; MD, mean diffusivity; AD, axial diffusivity; RD, radial diffusivity; ICVF, intra-neurite volume fraction; ODI, orientation dispersion index; ISOVF, volume fraction of the isotropic compartment.
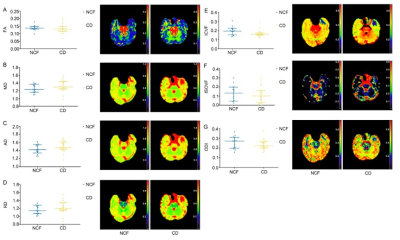
    Figure 2. Differences of DTI parameters including FA (A), MD (B), RD (C) and MD (D) as well as NODDI parameters including ICVF (E), ISOVF (F) and ODI (G) of edema lesions between patients with or without cognitive decline in RI. RI, radiation- induced brain injury; NCF, normal cognitive function; CD, cognitive decline; FA, fractional anisotropy; MD, mean diffusivity. AD, axial diffusivity; RD, radial diffusivity; ICVF, intra-neurite volume fraction; ODI, orientation dispersion index; ISOVF, volume fraction of the isotropic compartment.
  • Post-surgery network reorganization in glioma patients: a longitudinal study of functional segregation and centrality
    Beatrice Federica Luciani1, Francesca Saviola1, Luca Zigiotto2,3, Stefano Tambalo1, Domenico Zacà1, Lisa Novello1, Silvio Sarubbo2,3, and Jorge Jovicich1
    1CIMeC Center for Mind/Brain Sciences, University of Trento, Rovereto (Trento), Italy, 2Department of Neuroscience, Division of Neurosurgery, S.Chiara Hospital, APSS, Trento, Italy, 3Structural and Functional Connectivity Lab, S.Chiara Hospital, APSS, Trento, Italy
    Left-lateralized gliomas and high-grade gliomas reduce longitudinal functional segregation and centrality after surgical resection. The Default Mode Network supports post-surgical plasticity, highlighting its relevance for pre-surgical planning.
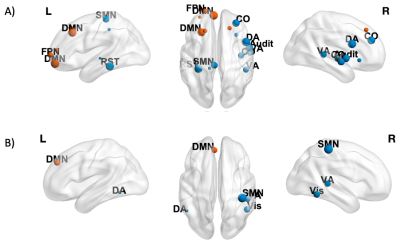
    Nodes showing a significant negative effect (β<0, p<0.05 FDR-corrected) of Time on CI (A) and BC (B) are shown in blue (non-hubs) and orange (hubs). Nodes are weighted for the statistical significance (p-value). For image display purposes, concerning CI, labels are plotted for most significant nodes (threshold 0.03).
    Nodes showing a significant negative effect (β<0, p<0.05 FDR-corrected) of Time × Tumor grade on Cl in LGG patients are represented in blue (non-hubs) and orange (hubs). Nodes are weighted for the statistical significance (p-value). For image display purposes, concerning Cl, labels are plotted for most significant nodes (threshold 0.03).
  • Fast 3D Wave-CAIPI Susceptibility Weighted Imaging and SPACE FLAIR for Comprehensive Evaluation of Demyelinating Lesions in Multiple Sclerosis
    Augusto Lio M. Goncalves Filho1,2, Azadeh Tabari1,2, Chanon Ngamsombat3, Ilena George4, Stephen F. Cauley2, Wei Liu5, Daniel N. Splitthoff6, Wei-Ching Lo7, Pamela W. Schaefer1, Otto Rapalino1, Eric C. Klawiter4, John Conklin1,2, and Susie Y. Huang1,2
    1Department of Radiology, Massachusetts General Hospital, Boston, MA, United States, 2Department of Radiology, Athinoula A. Martinos Center for Biomedical Imaging, Charlestown, MA, United States, 3Department of Radiology, Siriraj Hospital, Bangkok, Thailand, 4Department of Neurology, Massachusetts General Hospital, Boston, MA, United States, 5Siemens Shenzhen Magnetic Resonance Ltd., Shenzhen, China, 6Siemens Healthcare GmbH, Erlangen, Germany, 7Siemens Medical Solutions Inc., Boston, MA, United States
    Accelerated Wave-CAIPI susceptibility weighted imaging (SWI) and FLAIR may improve the characterization of demyelinating lesions within reasonable acquisition times and provide a more confident diagnosis of multiple sclerosis in brain MRI at 3T.
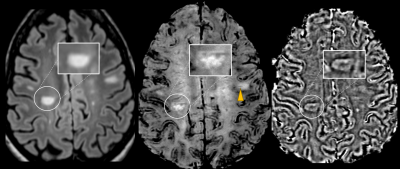
    Figure 1. Axial Wave-SPACE-FLAIR (left), Wave-SWI (middle), and phase images (right) in a 28-year-old patient with confirmed MS demonstrating the presence of paramagnetic rims corresponding to lesions visible on FLAIR (highlighted). A lesion with a central vein sign can be seen in the same Wave-SWI sequence (arrowhead).
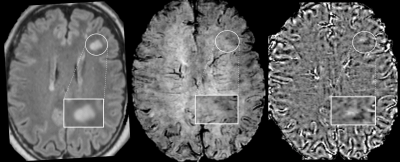
    Figure 3. Axial Wave-SPACE-FLAIR (left), Wave-SWI (middle), and phase images (right) in a 20-year-old patient with confirmed anti-MOG disease with no visible paramagnetic rim around the lesion visible on FLAIR (highlighted). No lesions with a central vein sign were identified on the Wave-FLAIR and Wave-SWI sequences.
  • Glioblastoma Recurrence vs. Radiotherapy Injury: Combined Model of DKI and 11C-MET Using PET/MR May Increase Accuracy of Differentiation
    Haodan Dang1, Ruimin Wang1, Jiajin Liu1, Huaping Fu1, Mu Lin2, Jiahe Tian1, Jinming Zhang1, and Baixuan Xu1
    1Department of nuclear medicine, Chinese PLA General Hospital, Beijing, China, 22. MR Collaboration, Diagnostic Imaging, Siemens Healthcare, Shanghai, China
    DKI, 11C-MET PET and histogram parameters provide complementary information about tissue. The decision-tree model combined of theses parameters has the potential to further increase diagnostic accuracy. 11C-MET PET/MR may thus contribute to the management of glioblastoma patients.
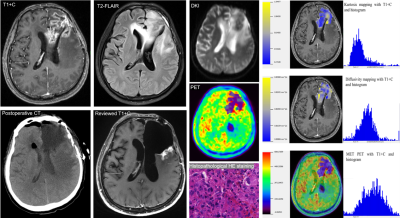
    Figure 1. The PET/MR images of glioblastoma recurrence.
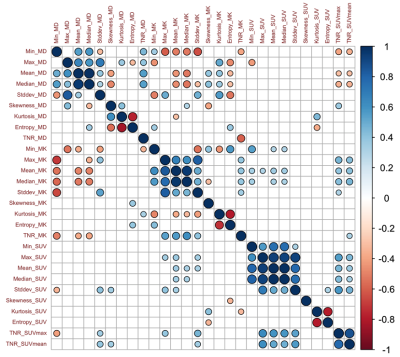
    Figure 2. Correlation matrix of each parameter pair with significance levels for glioblastoma recurrence (right upper part) and radiotherapy injury (left lower part) groups.
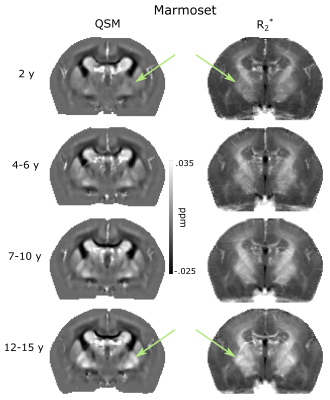
  • Usefulness of Quantitative Susceptibility MRI for the Detection of Iron in the Motor Cortex in Amyotrophic Lateral Sclerosis
    qianwen li1, juan Wei2, and jie Lu1
    1Xuanwu Hospital,Capital Medical University, Beijing, China, 2GE Healthcare, Beijing, China
    Quantitative Susceptibility Mapping (QSM), a newly developed quantitative and accurate measurement method that can be used to detect iron-related motor cortex alterations in patients of Amyotrophic lateral sclerosis (ALS) that may be relevant to pathologic changes.
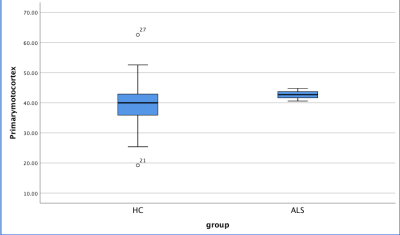
    Figure1.The susceptibility of primary motor cortex of ALS patients were significantly higher than those of controls
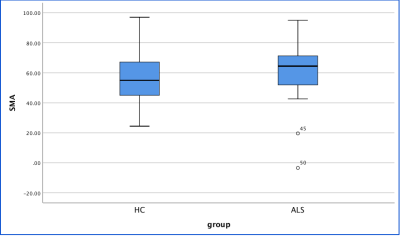
    Figure 2.The susceptibility of SMA of ALS patients were significantly higher than those of controls
  • Disturbed interhemispheric functional and structural connectivity in Type 2 diabetes
    Ying Cui1, Tian-yu Tang2, and Shenghong Ju1
    1Department of Radiology, Zhongda hospital, Southeast University, Nanjing, China, 2Southeast University, Nanjing, China
    T2DM patients showed disrupted interhemispheric coordination, especially in the occipital lobe. These disruptions are strongly correlated with insulin resistance, which might be an important treatment target to abate the cognitive decline in diabetic subjects.
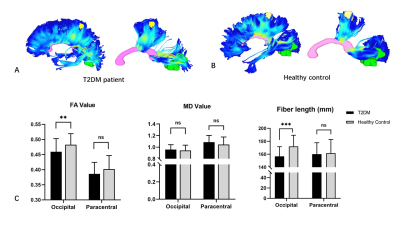
    Figure 2. Tractography results in representative subjects and group differences. The fibers connecting bilateral occipital lobes in T2DM representative (A) were slender and more diffusely orientated compared with the healthy controls (B). ** indicates P <0.01, *** indicates P <0.001.
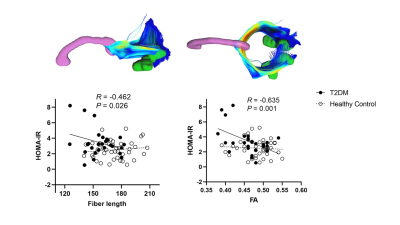
    Figure 3. Correlations between insulin resistance and the diffusion measures of the occipital fibers. Note that no such correlations were observed in the control group. The first row displays the occipital fibers derived from the HCP1021-1mm template (https://pitt.app.box.com/v/HCP1021-1mm).
  • Noninvasive assessment of MGMT promoter methylation status in grade II-IV gliomas using inflow-based vascular-space-occupancy
    Yuankui Wu1, Wenle He1,2, Wensheng Wang2, Jun Hua3,4, Xiang Xiao1, Xiaomin Liu1, Yikai Xu1, and Yingjie Mei5
    1Department of Medical Imaging, Nanfang Hospital, Southern Medical University, Guangzhou, China, 2Department of Radiology, Guangdong 999 Brain Hospital, Guangzhou, China, 3Neurosection, Division of MRI Research, Department of Radiology, Johns Hopkins University School of Medicine, Baltimore, MD, United States, 4F.M. Kirby Research Center for Functional Brain Imaging, Kennedy Krieger Institute, Department of Radiology, Johns Hopkins University School of Medicine, Baltimore, MD, United States, 5Philips healthcare, Guangzhou, China
    The top two CBVa histogram features in predicting MGMT promoter methylation in grade II – IV gliomas were RMS & Varianc. Combing CBVa histogram features and structural MRI features improved diagnostic performance.
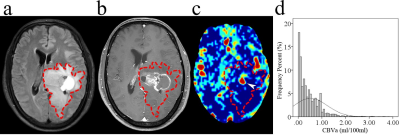
    Figure 1. Glioblastoma with MGMT promoter methylation in a 39-year-old male. (a) Axial T2-FLAIR image. (b) Axial postcontrast T1-weighted image. (c) Axial CBVa map (ml/100 ml). (d) Histogram of CBVa from whole tumor ROI (dashed line). Images show a left thalamic mass with cystic change, which involved the lateral ventricular walls but spared the cortices. The CBVa map shows focal hyperperfusion (arrowhead) in the mass. The corresponding histogram shows a narrow distribution of perfusion in the whole tumor which is mainly concentrated in hypoperfused areas.
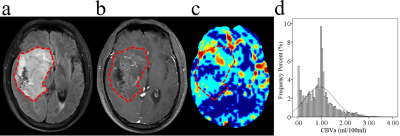
    Figure 2. Glioblastoma without MGMT promoter methylation in a 44-year-old male. (a) Axial T2-FLAIR image. (b) Axial postcontrast T1-weighted image. (c) Axial CBVa map (ml/100 ml). (d) Histogram of CBVa from whole tumor ROI (dashed line). The images show an inhomogeneous mass in the right temporal lobe, which invaded the right basal ganglia, the cortices, and the subventricular zone. The corresponding histogram shows a wide distribution of perfusion in the whole tumor, with a peak located at around 1.0 ml/100 ml.
  • Susceptibility-Based Characterization of Venous Distribution and Oxygen Extraction Fraction in Brains with Glioma at 7T
    Shihui Zhou1,2, Huilou Liang2,3, Yuchao Liang4, Siqi Cai1,2, Chunxiang Jiang1,2, Rong Xue2,3, Lei Wang4, and Lijuan Zhang*1
    1Shenzhen Institutes of Advanced Technology, Chinese Academy of Sciences, Shenzhen, China, 2University of Chinese Academy of Sciences, Beijing, China, 3State Key Laboratory of Brain and Cognitive Science, Beijing MRI Center for Brain Research, Institute of Biophysics, Chinese Academy of Sciences, Beijing, China, 4Neurosurgery, Beijing Tiantan Hospital of Capital Medical University, Beijing, China

    Venous and OEF distribution of the brain varies with the malignant grade of glioma. Low grade gliomas induce more extensive interhemispheric difference in venous and OEF distribution. Oxygenation changes were found coupled with altered venous distribution in brains with high grade glioma.
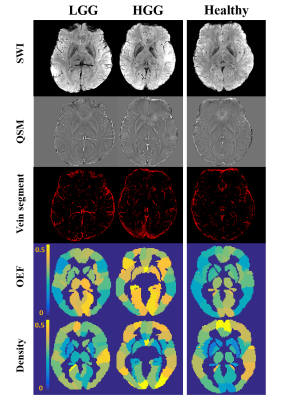
    Figure 1. Maps of vein density and OEF for representative low grade (LGG), high grade glioma (HGG) cases and control subject.
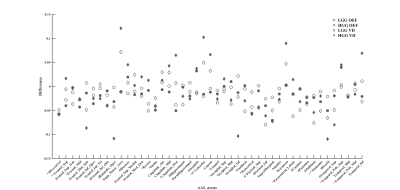
    Figure 2. Differential venous and OEF distribution based on AAL atlas. # *indicate significant interhemispheric difference of vein density(VD) and OEF in LGGs; ^ + indicate significant interhemispheric difference of VD and OEF in HGGs, resepectively (paired t test, p<0.05, FDR corrected).
  • Tau-mediated microstructural changes in the central tegmental tract in APOE-ε4 positive mild cognitive impairment
    Jason Langley1, Sana Hussain2, Daniel E Huddleston3, Ilana Bennett4, and Xiaoping P Hu1,2
    1Center for Advanced Neuroimaging, University of California Riverside, Riverside, CA, United States, 2Department of Bioengineering, University of California Riverside, Riverside, CA, United States, 3Department of Neurology, Emory University, Atlanta, GA, United States, 4Department of Psychology, University of California Riverside, Riverside, CA, United States
    Locus coeruleus axons project to the thalamus via the central tegmental tract (CTT). In the APOE-e4 positive group, CTT microstructural measures were positively correlated with thalamus tau-PET SUVR but no correlations were observed in the APOE-e4 negative group.

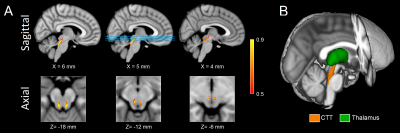
    Figure 1. Sagittal (A; top row) and axial (A; bottom row) of population maps showing the CTT ROI used in this analysis. The lines in sagittal view at X=5 mm identify the location of the axial slices shown in the bottom row in MNI space. A three dimensional rendering of the CTT is shown in B.

    CTT - central tegmental tract; ROI - region of interest; MNI - Montreal Neurological Institute

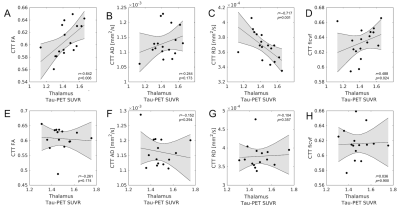
    Figure 3. Correlations between CTT microstructure metrics and thalamus tau-PET SUVR in APOE-ε4 positive subjects (top row; A-D) and APOE-ε4 negative subjects (bottom row; E-H). Significant correlations between CTT microstructure and thalamus tau-PET SUVR are seen in the APOE-ε4 positive group but not in the APOE-ε4 negative group.
  • Joint and individual statistical analysis of brain MRI and cognition measures in Alzheimer's Disease
    Raphiel Jamale Murden1, Deqiang Qiu2, and Benjamin B Risk2
    1Biostatistics and Bioinformatics, Emory University, Atlanta, GA, United States, 2Emory University, Atlanta, GA, United States
    Canonical Joint and Individual Variation Explained incoroporates a step to impute missing data and uses a computationally efficient permutation test to estimate the joint rank. Patterns of variation shared between measures of brain atrophy and cognition areassociated with diagnoses. 
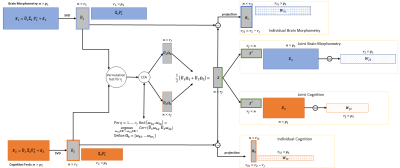
    Schematic of the CJIVE process. Singular value decomposition (SVD) is applied to the input data matrices (far left) to obtain dimension-reduced PC scores. Next, a permutation test is used to determine the number of components that will lie in the joint subspace. CCA is applied to the PC scores and a weighted average of canonical variables determines the joint subspace. Finally, individual subspaces can be determined by the orthogonal complement of the joint subspace within the respective PC subspaces.

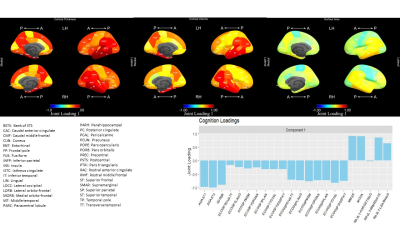
    Joint Loadings for component 1. Temporal lobe ROI measures were most prominent among morphometry loadings, including both thickness and volume. ADAS and MMSE dominated cognition loadings (bottom) and both have been shown as excellent diagnostic tools. The proportions of total variation explained by the first joint component were 0.147 for morphometry and 0.467 for cognition. Proportions explained by the second component (not shown) were 0.025 and 0.044 for morphometry and cognition, respectively.

  • Functional connectivity-based prediction of Autism on site harmonized ABIDE dataset
    Madhura Ingalhalikar1, Sumeet Shinde1, Arnav Karmarkar1, Archith Rajan1, Rangaprakash D2, and Gopikrishna Deshpande3
    1Symbiosis Centre for medical image analysis, Symbiosis international university, Pune, India, 2Martinos Center for Biomedical Imaging, Massachusetts General Hospital, Boston, MA, United States, 3Department of Electrical and Computer Engineering, Auburn University, Auburn, AL, United States
    Superior prediction of Autism on ABIDE dataset is demonstrated as we include site-harmonization before applying machine learning algorithms. The ablation analysis provides sub-network based interpretability.
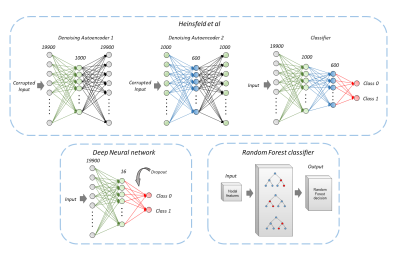
    Figure 1: Schematic diagram of all the classification methods used. An artificial neural network (ANN) based classifier was implemented along with a Random forest (RF) of classification trees. Architecture for classification involving denoising autoencoders based on Heinsfeld et al has been shown.
    Figure 2: Brain maps showing ROIs associated with each of the 12 networks used in ablation analysis
  • Ultra-High Field Sodium MRI in Alzheimer’s Disease Reveals Stage-dependent Metabolic Alterations Associated with Tau-pathology
    Alexa Haeger1,2,3, Michel Bottlaender1,4, Julien Lagarde4,5,6, Renata Porciuncula Baptista1, Cécile Rabrait-Lerman1, Volker Luecken2,3, Jörg Bernhard Schulz2,3, Alexandre Vignaud1, Marie Sarazin4,5,6, Kathrin Reetz2,3, Sandro Romanzetti2,3, and Fawzi Boumezbeur1
    1BAOBAB, CNRS, Paris-Saclay University, CEA-NeuroSpin, Gif-sur-Yvette, France, 2Department of Neurology, RWTH Aachen University, Aachen, Germany, 3JARA-BRAIN Institute of Molecular Neuroscience and Neuroimaging, Forschungszentrum Jülich GmbH, Julich, Germany, 4BioMaps, CNRS, Inserm, Paris-Saclay University, CEA-SHFJ, Orsay, France, 5Neurology of Memory and Language, GHU Paris Psychiatrie & Neurosciences, Sainte-Anne Hospital, Paris, France, 6Université de Paris, Paris, France
    By combining quantitative 23Na MRI at 7 Tesla with Tau/Amyloid-PET, we show that total sodium concentration is increased in AD patients compared to controls and that these changes are more strongly correlated with local Tau- than Amyloid-loads.
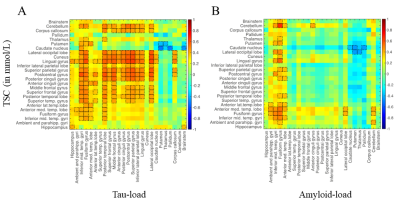
    Figure 4. Correlation matrices between TSC versus local Tau load (A) and versus local Amyloid load (B). Notable correlations are reported at an uncorrected p < 0.05 level of significance and are framed in black.
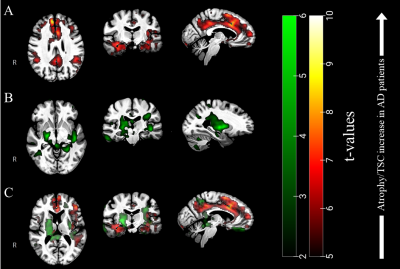
    Figure 3. (A) T-values resulting from voxel-based permutation analyses of our TSC maps (AD > Controls) and (B) atrophy clusters in green (Controls > AD), overlaid to our group template. (C) From the overlay of both TSC and atrophy clusters, one can appreciate the differences between both pathological patterns.
  • Feasibility of Arterial Spin Labeling for Detection of Longitudinal Changes in Perfusion in Elderly and Frontotemporal Dementia Patients
    Tracy Ssali1,2, Lucas Narciso1,2, Matthais Günther3, Frank Prato1,2, Udunna Anazodo1,2, Elizabeth Finger4, and Keith St Lawrence1,2
    1Lawson Health Research Institute, London, ON, Canada, 2Department of Medical Biophysics, Western University, London, ON, Canada, 3Fraunhofer Institute for Medical Image Computing MEVIS, Bremen, Germany, 4Department of Clinical Neurological Sciences, Western University, London, ON, Canada
    Longitudinal variability in perfusion among frontotemporal dementia patients and healthy controls was assessed on a voxel-by-voxel basis over a month. Power analysis revealed ASL has the sensitivity to longitudinal changes as low as 7-8%. 
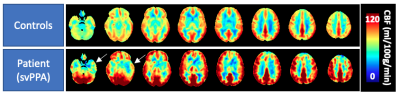
    Figure 1: Perfusion averaged over all healthy controls and an exemplary dementia patient participant with semantic variant primary progressive aphasia (svPPA). White arrows indicate regional perfusion deficits.
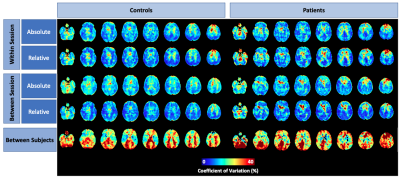
    Figure 3: Within-session and between-session coefficient of variation maps in healthy controls and FTD patients using absolute and relative perfusion.